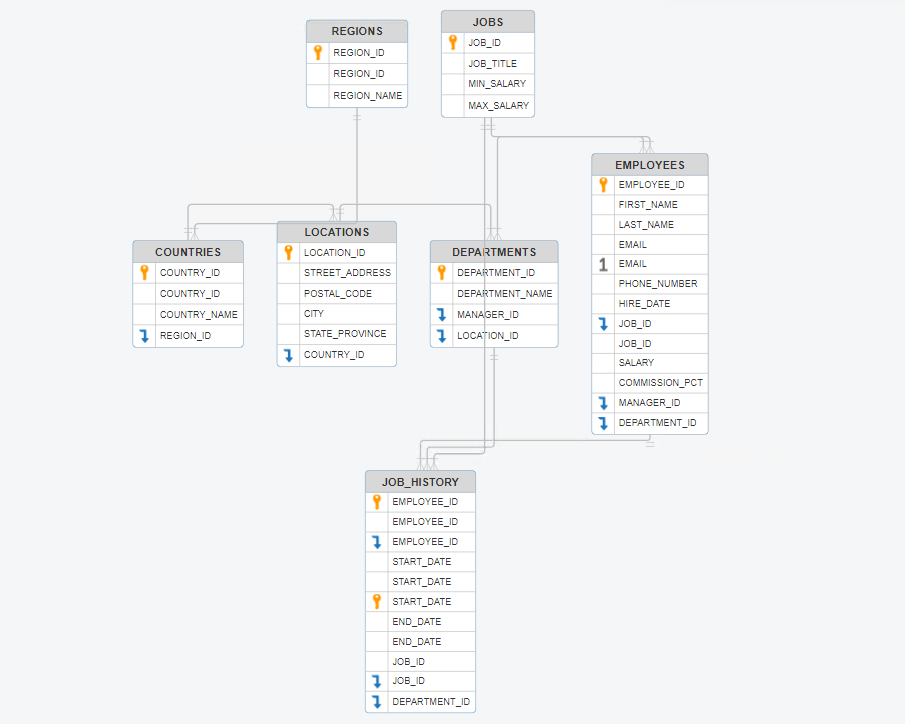
SmartDraw can generate a visual representation of your database automatically. First, you'll want to export a CSV of your table definitions from your database server. SmartDraw will use this file to generate a visual of your database using the ERD Diagram Data Visualizer.
Preparing Your Data
For Microsoft SQL Server
Run this query, modifying for your specific needs.
For MySQL
Run this query, modifying for your specific needs.
For PostgreSQL
Run this query, modifying for your specific needs.
For Oracle
Run this query, modifying for your specific needs.
Build Your ERD Diagram
Once you have a CSV file from your database, you're ready to generate your ERD. To get started, click the + icon to switch the SmartPanel into the Insert Content view.
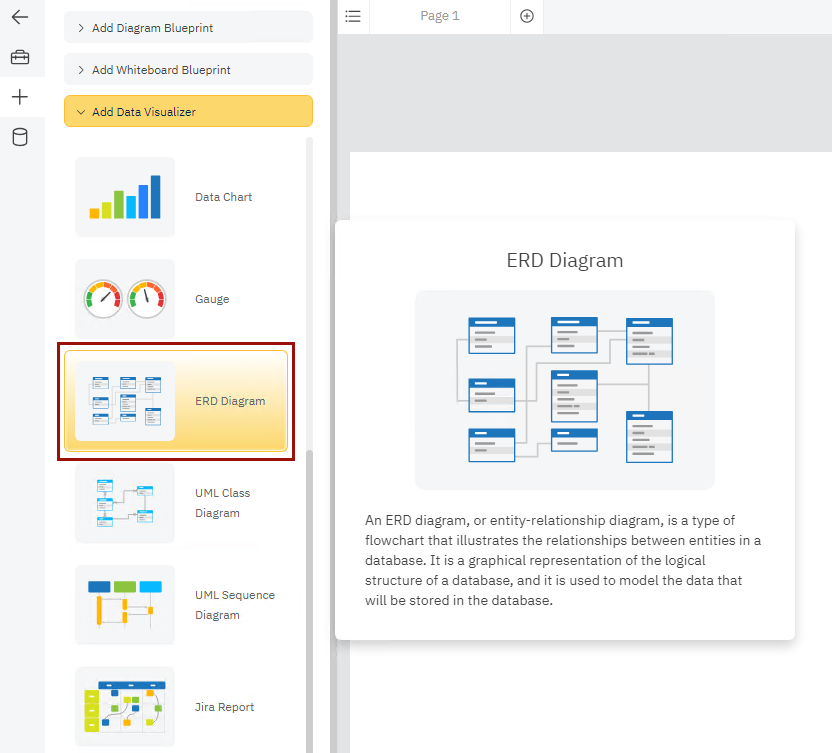
Once on the Insert Content view, select the Add Data Visualizer category and click on ERD Diagram.
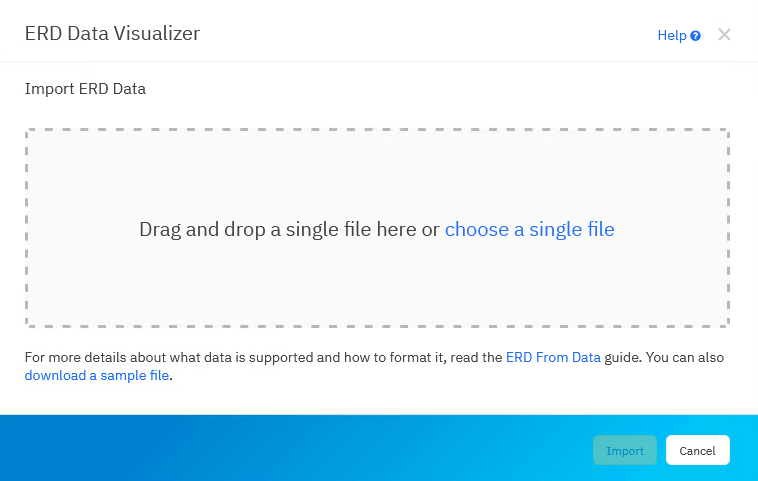
Drag and drop your table definition CSV file to the modal or click choose files to browse through your system.
Once the file is loaded and parsed, you can Show Table List to see how SmartDraw sees your data.
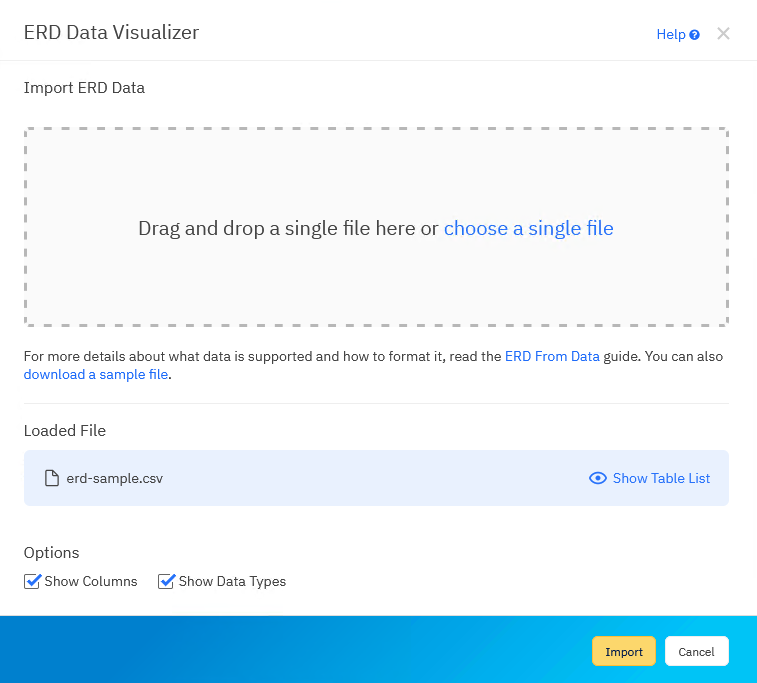
You can check or uncheck any data tables you want to include in your final ERD.
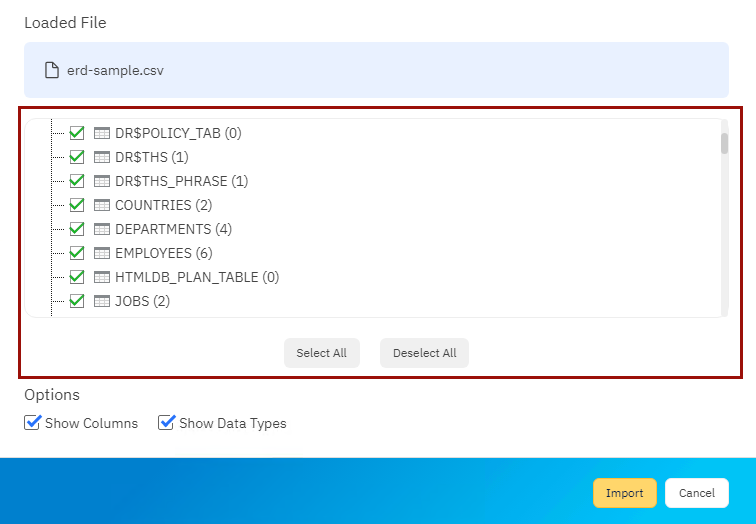
Click Import when you're ready to generate your diagram.
Once the import is complete, you can edit your database diagram like any other SmartDraw diagram.